Material Assumptions and Methods
The following are material assumptions used when calculating the hypothetical results that appear on the InvestiQuant website.
Unless noted, the performance shown is hypothetical backtested performance. Backtested performance is calculated by running a trading system backwards in time, and seeing what trades would have been done in the past when applied to backadjusted data.
Backtesting can have limitations, one way we combat those limitations is by using realistic profit target trade fills. Although we cannot guarantee you would have been filled at the exit price of these trades as shown, we require the profit target price to be traded through by at least 1 tick for it to count as a winner in hypothetical results. This is the most realistic and conservative method we have to illustrate trades in the performance results.
Estimated commissions and slippage are included and based on real world experience. When calculating cumulative returns, we include a $7 round trip commission and $12.50 in slippage. This equated to a total of $19.50 that is deducted from each round turn trade. This amount may overstate or understate the impact of commissions and slippage in live trading. Other fees such as exchange fees, brokerage fees, transaction fees and NFA fees still apply.
Hypothetical returns of portfolios do not include InvestiQuant license fees.
Please note that the method of resetting the model account to the initial value at the start of each month creates a track record which is representative of the simple percentage returns for each time period, but that it does not, by definition, show how returns would compound over time. Should an investor following a given portfolio trade a single contract indefinitely without also resetting their account to the initial capital amount each month, their performance will differ from the performance detailed herein. Simply said, subscriber performance in dollars should be similar to the displayed trading results, but without initially starting at the portfolio value or resetting to the monthly portfolio value at each month end, the percentage return achieved will not match the shown performance.
Account values may fluctuate, sometimes greatly, during the month posted. For example, during a particular month, a significant loss could occur which is then followed by a significant gain. While the monthly total in the tables will reflect the sum of daily events, the System Statistics for Worst Drawdown and Worst Drawdown Period will reflect the individual events. It is possible to have a month with a profit but still be in a drawdown period. Drawdown should not only be measured from monthly change data though this data is significant for variety of investment evaluations.
Key Definitions
- % of Days in Market is the percentage of trading days in which the portfolio had a trade.
- % Winning Days is calculated by dividing the sessions that resulted in a profit by the total number of sessions traded.
- Annual ROI is the lifetime returns of the strategy divided by the years since inception.
- Average Losing Day is calculated by dividing the gross losses by the number of days that finish with a loss for the session.
- Average Winning Day is calculated by dividing the gross profit by the number of days that finish with a profit for the session.
- Calmar Ratio is calculated by dividing the compound annual growth rate of the last 3 years by the maximum drawdown of the last 3 years.
- Consecutive Losing Days is the maximum amount of consecutive sessions where there was trading activity for the session and the daily result for the portfolio was a loss.
- Consecutive Winning Days is the maximum amount of consecutive sessions where there was trading activity for the session and the daily result for the portfolio was a profit.
- Funded Capital is the capital that the displayed metrics are based on.
- Largest Daily Loss is the maximum amount that the portfolio lost on a single trading session.
- Largest Daily Win is the maximum amount that the portfolio profited on a single trading session.
- Maximum Drawdown is the largest difference measured between a prior equity high (on a closed trade basis) to the lowest subsequent equity low (on closed trade basis), for all trades since inception. While this is useful information when evaluating trading systems, you should keep in mind that past performance does not guarantee future results. Therefore, future drawdowns may be larger than the historical maximum drawdowns you see here and you should plan accordingly.
- Profit Factor is calculated by dividing the gross profit by the gross loss.
- Sharpe Ratio is calculated using the daily returns. The formula for calculating it is:
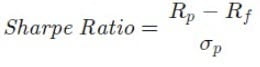
Where: Rp=return of portfolio
Rf=risk-free rate
σ=standard deviation of the portfolio’s excess return - Return from Inception is defined as the percent change in funded capital since the starting date of the system.
- Monthly Net Returns show the percentage the portfolio gained or lost each month. The total is a percentage gain or loss based on the funded capital and is reset to the starting amount each month.
- Year to Date Return is calculated by dividing the total return since the beginning of the current year by the funded capital.
HYPOTHETICAL PERFORMANCE RESULTS HAVE MANY INHERENT LIMITATIONS, SOME OF WHICH ARE DESCRIBED BELOW. NO REPRESENTATION IS BEING MADE THAT ANY ACCOUNT WILL OR IS LIKELY TO ACHIEVE PROFITS OR LOSSES SIMILAR TO THOSE SHOWN. IN FACT, THERE ARE FREQUENTLY SHARP DIFFERENCES BETWEEN HYPOTHETICAL PERFORMANCE RESULTS AND THE ACTUAL RESULTS SUBSEQUENTLY ACHIEVED BY ANY PARTICULAR TRADING PROGRAM. ONE OF THE LIMITATIONS OF HYPOTHETICAL PERFORMANCE RESULTS IS THAT THEY ARE GENERALLY PREPARED WITH THE BENEFIT OF HINDSIGHT. IN ADDITION, HYPOTHETICAL TRADING DOES NOT INVOLVE FINANCIAL RISK, AND NO HYPOTHETICAL TRADING RECORD CAN COMPLETELY ACCOUNT FOR THE IMPACT OF FINANCIAL RISK IN ACTUAL TRADING. FOR EXAMPLE, THE ABILITY TO WITHSTAND LOSSES OR ADHERE TO A PARTICULAR TRADING PROGRAM IN SPITE OF TRADING LOSSES ARE MATERIAL POINTS WHICH CAN ALSO ADVERSELY AFFECT ACTUAL TRADING RESULTS. THERE ARE NUMEROUS OTHER FACTORS RELATED TO THE MARKETS IN GENERAL OR TO THE IMPLEMENTATION OF ANY SPECIFIC TRADING PROGRAM WHICH CANNOT BE FULLY ACCOUNTED FOR IN THE PREPARATION OF HYPOTHETICAL PERFORMANCE RESULTS AND ALL OF WHICH CAN ADVERSELY AFFECT ACTUAL TRADING RESULTS. Testimonials TESTIMONIALS SHOWN ON THE SITE AND REFERENCED FROM TIME TO TIME ARE FROM SELECT CUSTOMERS. THEIR EXPERIENCES MAY NOT BE TYPICAL OF WHAT YOU CAN EXPECT TO ACHIEVE, AS RESULTS MAY VARY. CLAIMS CONTAINED WITHIN TESTIMONIALS HAVE NOT BEEN VERIFIED. CUSTOMERS WERE NOT PAID OR COMPENSATED IN ANY WAY FOR THEIR STATEMENTS.