Three new powerful features have been added to iQ Discover in this new September release, designed to enhance your research and guidance.
- Results Trade Distribution Histogram
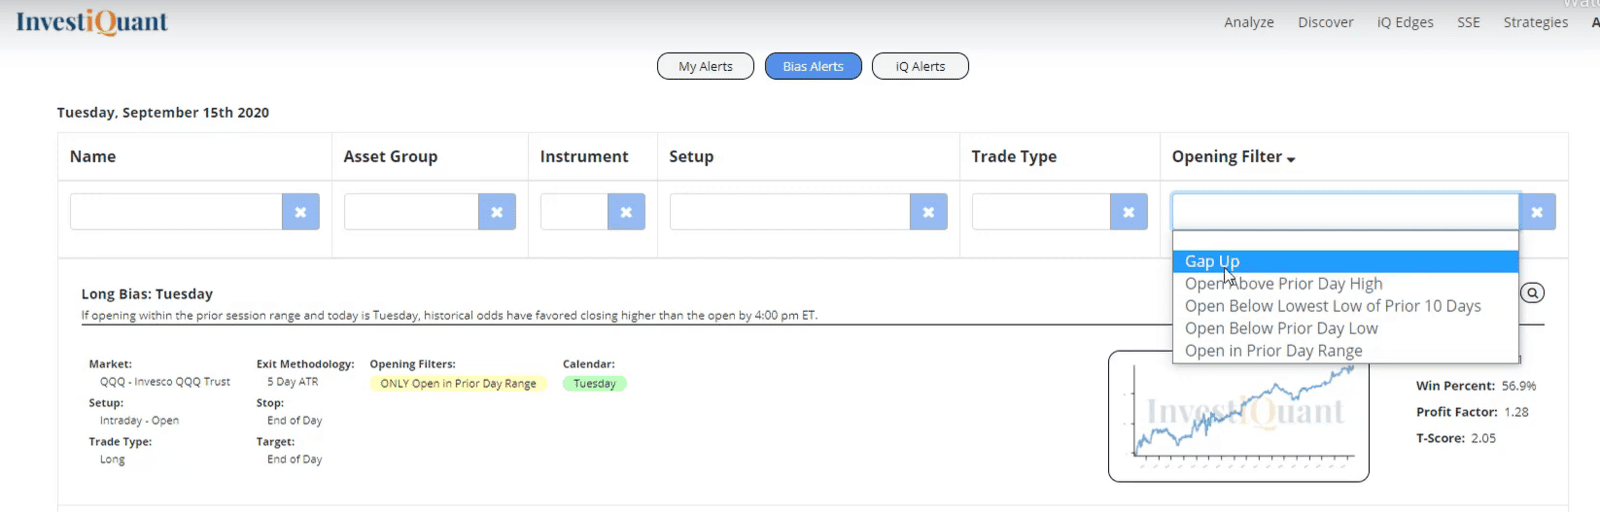
- New Sortable Opening Filters for Alerts
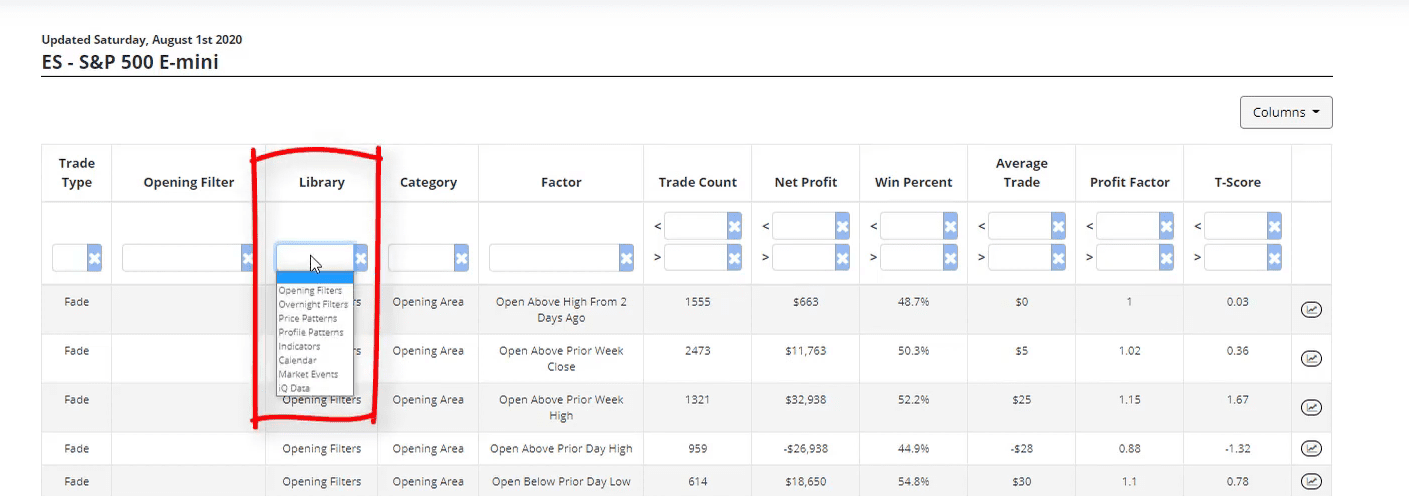
- Overnight Filters added to SSE
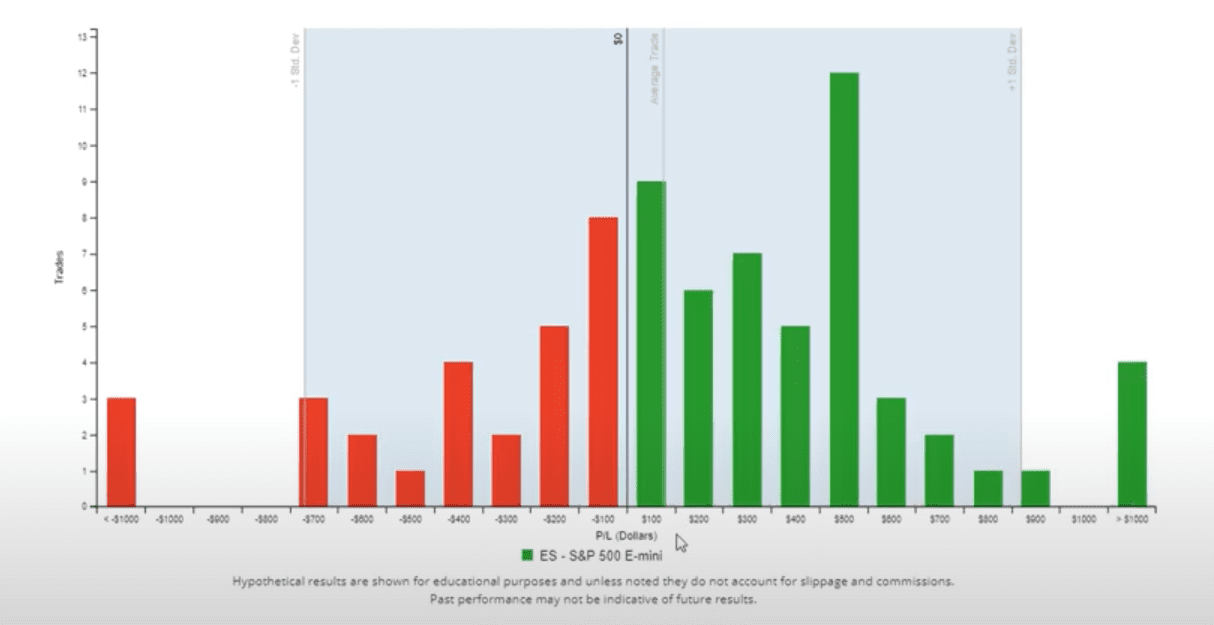
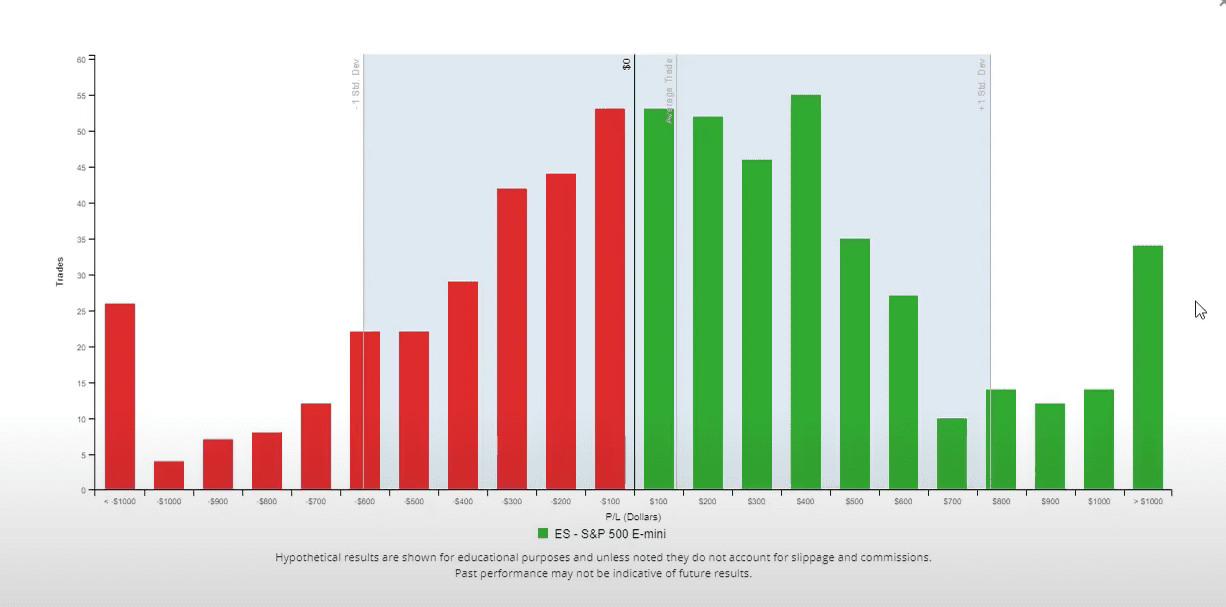
The new Results Distribution feature on the View Results page of Discover was created to give you more information about the trades you are studying. The graph allows you to see the results of the setup you are testing in a histogram view which instantly shows you how all the trades have played out historically. This can be used to see what is a normal expectation and how often has the trade been impacted by outliers..
The graph shows the distribution of trade results in the following format.
Vertical Axis: Trade count (sample sizes), the taller the bar the more trades it reflects for that result. Small bars show low sample sizes for the result.
Horizontal Axis: Profit and Loss. The horizontal axis plots the profits and losses for the trades. The far left of the chart are the largest losses. The far right of the chart of the largest profits. In the middle of the chart is the $0 line and the smallest trade results fall next to it.
Blue Highlighting: The blue highlighted section of the chart represents +/-1 Standard deviation of the average trade.
Green Bars: Winning Trades
Red Bars: Losing trades