Autotrading is a powerful tool, but success requires the proper mindset and expectations. There are 6 fundamental principles every investor must understand and accept.
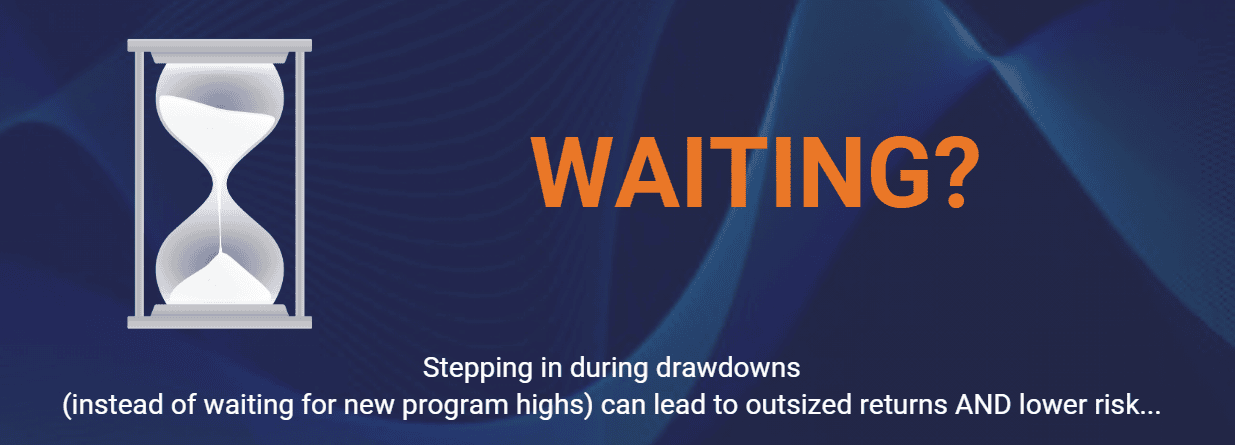
When is the best time to start autotrading?
Have you heard us talk about autotrading units and weren’t sure exactly what that meant? Check out this 1-minute video where I explain what it means and how it impacts autotrading.
Take advantage of iQ Autotrading’s adaptive and self-regulating features BEFORE our programs capture their next wave of profits. Plus two special offers in March!
If you are not using an IRA to autotrade then you may wonder how taxes are treated when autotrading. This short video explains the tax benefits provided by the futures contracts we use to autotrade.
Are you wondering how you would go about participating in autotrading? Check out this short video that goes over the 2 steps you would need to complete to begin autotrading with iQ.
In this video from a professional Money Manager, you get to hear how he uses iQ as part of his portfolio and other key points.
Drawdowns happen, here are seven helpful tips for dealing with them when they come.
What Program is Best to get Started With?
When is the best time to start?
Mike Fickell spent 15 years on Wall Street as an institutional portfolio manager. And, as a long term iQ client, he has a couple of helpful tips for investors...
A common concern about autotrading is investor experience level.
When autotrading it is important to understand these tips to see the most success. Take 90 seconds and internalize these tips to set yourself up for success.
When it comes to autotrading, the markets being traded are extremely important. Even more so than if you were trading on your own. Check out this video to learn about why the liquidity of a market is important when autotrading.
Download “5 Ways to Know if You’re Considering the Right Autotrading Firm,” to learn how InvestiQuant sets itself apart from the competition. Discover why iQ focuses on integrity over flashy marketing, emphasizes smart, tax-advantaged strategies, and brings decades of real market experience. Get ins...
#6 -The firm does NOT rely on overseas brokerage firms (who may trade against you)
InvestiQuant (iQ) avoids risky overseas brokerages and only utilizes highly regulated brokers registered with U.S securities agencies.
#5 -The firm’s strategies were NOT developed by retail traders who have no profe...
Did you know the funding levels for our programs are not set in stone? Here is a simple way to get the biggest return from the capital you have available.
Why does iQ trade Futures instead of stocks?
Bear markets don’t have to be scary, they can be very profitable if you are prepared ahead of time with iQ’s autotrading programs.
Learn more about the access and control you have over your iQ autotrading account.