Blog tagged as ES - S&P 500 E-Mini
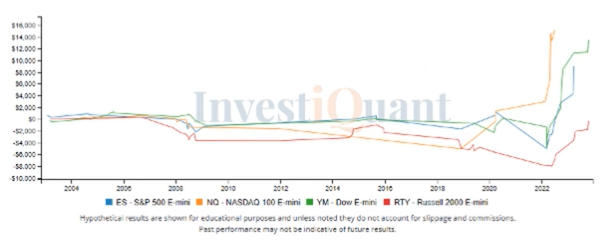
The markets put in a doji following the recent strong rally, here's is what has happened following that pattern. To view the video and summary data, click on the performance graph above or the "Read more" button below.
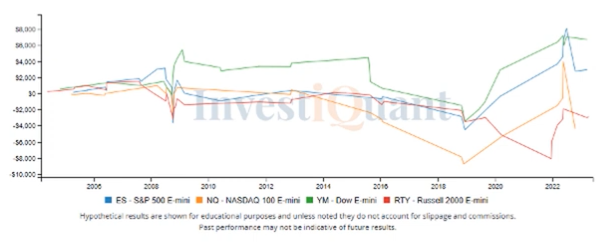
The markets triggered overbought reading on Friday's close, here is what has happened following that. To view the video and summary data, click on the performance graph above or the "Read more" button below.
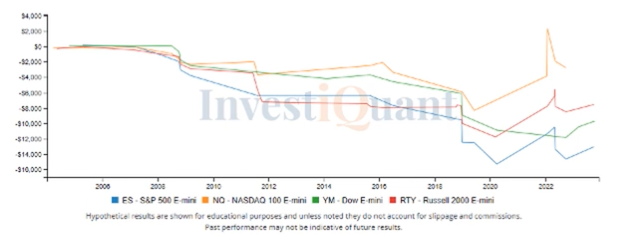
The Non-farm payrolls report is today at 8:30 am ET. Here is what has happened on this day historically. To view the video and summary data, click on the performance graph above or the "Read more" button below.
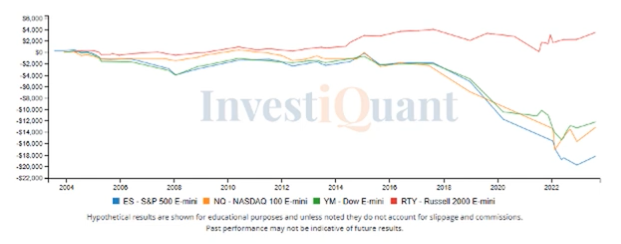
Today is the second trading day of the month, here is what has happened on this day historically. To view the video and summary data, click on the performance graph above or the "Read more" button below.
The FOMC announcement is today at 2:00 pm ET. Here is how that day has performed historically. To view the video and summary data, click on the performance graph above or the "Read more" button below.
Today is the last trading day of October, here is how it has performed historically. To view the video and summary data, click on the performance graph above or the "Read more" button below.
Tomorrow is the last day of October, here is how this day has performed historically. To view the video and summary data, click on the performance graph above or the "Read more" button below.
The markets have sold off this week, here is how Fridays have performed in bearish environments. To view the video and summary data, click on the performance graph above or the "Read more" button below.
The markets consolidated higher yesterday, here is what has followed in similar market environments. To view the video and summary data, click on the performance graph above or the "Read more" button below.
The markets made new lows yesterday then rallied, lets see what has happened following that pattern. To view the video and summary data, click on the performance graph above or the "Read more" button below.
The markets closed at lows on Friday, here is what has happened following that into a new week. To view the video and summary data, click on the performance graph above or the "Read more" button below.
Today is option expiration, here is how this day has performed following weakness. To view the video and summary data, click on the performance graph above or the "Read more" button below.
Tomorrow is options expiration day, here is how the day before has performed historically. To view the video and summary data, click on the performance graph above or the "Read more" button below.
This is options expiration week, here is how Tuesdays have performed during this week. To view the video and summary data, click on the performance graph above or the "Read more" button below.
The market is trading higher following a bearish close on Friday, here is how that has played out historically. To view the video and summary data, click on the performance graph above or the "Read more" button below.
The markets put in a neutral extreme day yesterday, here is what has happened following those days. To view the video and summary data, click on the performance graph above or the "Read more" button below.
The markets signaled an overbought reading yesterday, here is what has happened following this overbought reading while in a similar market environment. To view the video and summary data, click on the performance graph above or the "Read more" button below.
The markets put in a shooting star candlestick pattern yesterday, here is what has happened following that pattern.. To view the video and summary data, click on the performance graph above or the "Read more" button below.
The markets are bouncing off extreme lows, let's see how these patterns have played out historically. To view the video and summary data, click on the performance graph above or the "Read more" button below.
The Nonfarm Payrolls report is today at 8:30 am ET, here is what has happened on this day historically. To view the video and summary data, click on the performance graph above or the "Read more" button below.